Weather Radar: What Every Colour Means
Five numbers your weather app is hiding from you
Every time a thunderstorm appears on your phone, you are looking at NEXRAD data: a network of 159 Doppler radar stations run by NOAA that scan the full United States atmosphere every 4 to 6 minutes. The colourful blobs your app shows are one product called reflectivity, but NEXRAD actually generates dozens of products. Most consumer apps expose one. Knowing what the other layers show, and what the scale numbers mean, is the difference between "it looks stormy" and "that cell is producing hail and may be rotating." This reference covers the five layers that matter: the dBZ reflectivity scale, base versus composite views, velocity mode, dual-polarization products, and the practical limits that apply to all of them.
dBZ range
What it usually means | What to watch for
Below 20
Drizzle, snow flurries, ground clutter | Nothing urgent
20 to 35
Light rain, light snow | Slow-moving cells can still flood
35 to 50
Moderate to heavy rain, developing storm | Track movement and speed
50 to 60
Heavy rain, possible small hail | Likely severe; seek shelter
60 to 65
Large hail probable (1 inch or more) | Dangerous; do not drive
Above 65
Extreme core, water-coated hail | Life-threatening; take cover now

dBZ: a logarithmic measure, not a percentage
The colours on a radar map represent dBZ values: decibels of Z, where Z is the radar reflectivity factor measured in mm6/m3. The logarithmic scale compresses an enormous natural range (near zero in clear air, up to 36,000,000 in severe hail) into a practical span of roughly minus 35 to plus 75. Because the scale is logarithmic, each step of 10 dBZ represents roughly a tenfold increase in returned energy. A cell showing 60 dBZ has returned about 100 times as much energy as a 40 dBZ drizzle band. NWS operates in two modes: clear air mode (minus 28 to plus 28 dBZ, sensitive enough to detect insects and smoke) and precipitation mode (5 to 75 dBZ). Most apps switch to precipitation mode automatically when rain is detected.
Base reflectivity vs. composite reflectivity
Two products look nearly identical but tell different stories. Base reflectivity uses the lowest elevation scan, typically 0.5 degrees above horizontal, and updates every 4 to 6 minutes. It is the best view for detecting low-level features like hook echoes and bow echoes, because it samples air close to the ground. Composite reflectivity stacks every elevation scan and shows the highest dBZ value found at any altitude in the column. It takes a full volume scan (4 to 7 minutes) to produce. A cell showing 45 dBZ on base but 60 dBZ on composite has a high-altitude hail core that has not yet reached the surface: a warning that conditions at ground level are about to worsen. Most apps default to composite for dramatic colour; switch to base when you want to know what is happening at ground level right now.
Product
Updates | Best for | Watch out for
Base reflectivity (0.5 deg)
4 to 6 min | Hook echoes, low-level rain | Misses high-altitude hail cores
Composite reflectivity
4 to 7 min | Overall storm intensity | Masks fine low-level detail
Velocity (base, 0.5 deg)
4 to 6 min | Rotation, inflow, outflow | Only available in specialised apps
Velocity mode: seeing the wind inside a storm
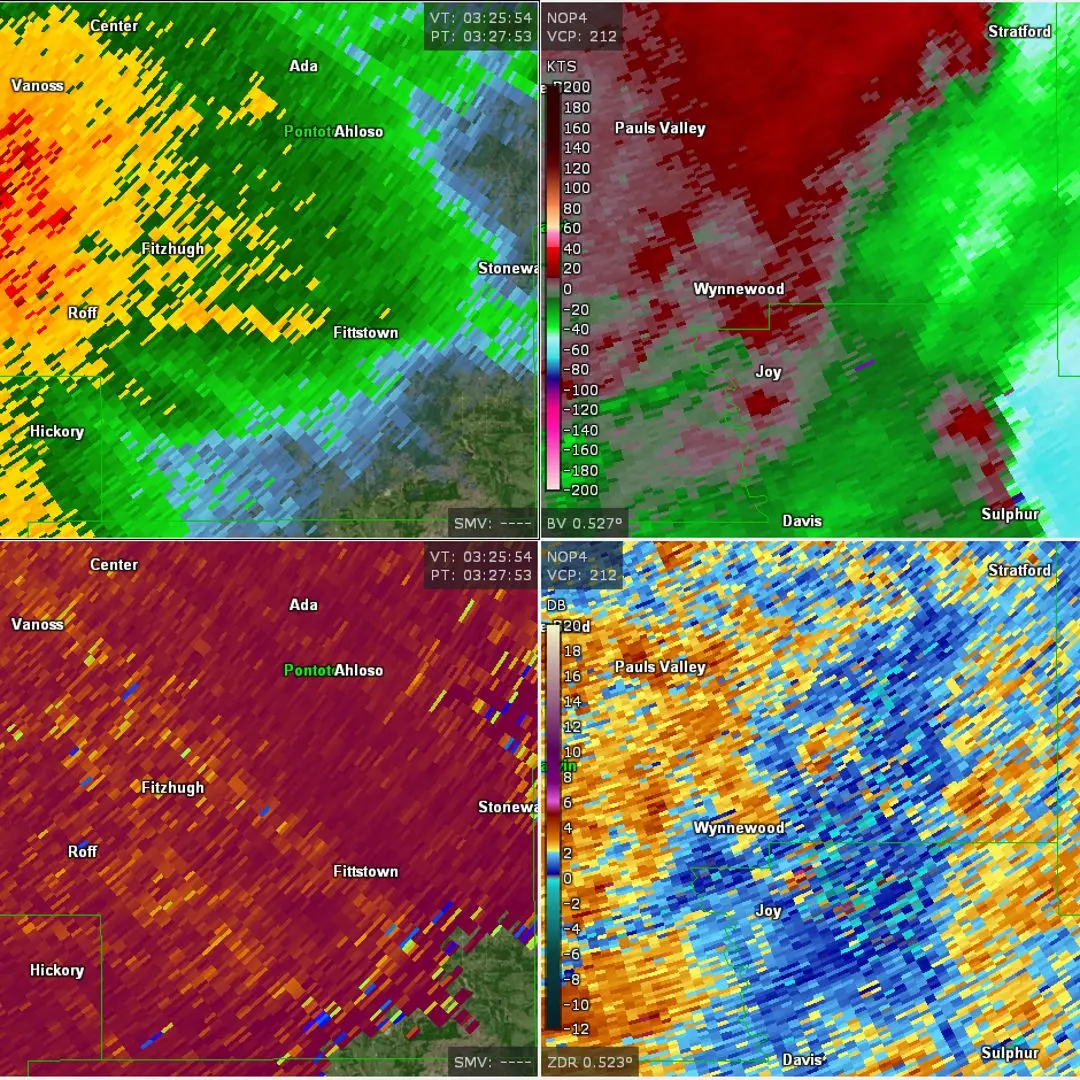
Reflectivity shows how much is falling. Velocity mode shows how fast the precipitation particles are moving toward or away from the radar. The colour code flips from the intuitive: green means motion toward the radar, red means motion away. A tight patch of bright green immediately beside bright red, at the same range from the radar, is called a couplet. It means the air at that point is rotating: one side moving toward the radar, the other moving away, within a very short distance. A strong, compact couplet is the signature meteorologists call a mesocyclone. Forecasters can issue a tornado warning based on a tight velocity couplet alone, before any visual confirmation and before a hook echo appears in reflectivity. Most consumer weather apps do not show velocity data at all. RadarScope, Radarbot Pro, and the NWS own site (radar.weather.gov) all expose velocity products.
Dual-polarization: shape, not just strength
Since 2013, all NWS NEXRAD radars pulse both horizontally and vertically, producing two extra products that reveal the shape and consistency of what the radar is sampling. Differential Reflectivity (ZDR) compares horizontal to vertical return: large, oblate raindrops produce a high ZDR; round hailstones produce near-zero ZDR. Correlation Coefficient (CC, also written as rho-hv) measures how similar successive pulses look. Rain and snow score high (0.97 to 1.00). A mix of tumbling debris, shingles, and tree branches scores very low (below 0.80). When a tornado lofts debris to the height of the radar beam, CC drops sharply inside the rotation signature. That drop, co-located with a strong velocity couplet and high reflectivity, is a Tornado Debris Signature (TDS). A confirmed TDS means a tornado is on the ground at that moment. NWS forecasters treat it as ground truth.

Five limits that apply to every radar image. First, the beam rises with distance: at 100 miles from the radar the 0.5 degree scan is already 5,000 feet above the ground, so surface precipitation may be invisible. Second, terrain blockage: mountains and tall buildings create permanent shadows. Third, attenuation: a very heavy rain core can absorb the radar beam, making whatever is behind it look weak or empty. Fourth, timing lag: the image you see is 4 to 7 minutes old. Fifth, coverage gaps: the