Read Your Electricity Bill: Every Charge Decoded
Your electricity bill is not one charge. It is four or five stacked on top \
of each other, printed in a font designed to discourage reading. The number at the top is the result. The numbers in the middle tell you which parts you can reduce, which parts are fixed no matter what you do, and, if you live in one of the 13 states with energy choice, which part you can shop elsewhere. Most people skip those middle lines and wonder why the total keeps climbing. This guide names every charge, gives typical cost ranges sourced from EIA and utility filings, explains the two completely different bill structures in the US, shows you how to calculate the rate you are actually paying (which is always higher than the advertised rate), and closes with a table of the five most common bill spikes and what causes each one.
The five line items and what each one pays for
Almost every US residential electricity bill contains some version of these five charges. The names vary by utility but the structure is consistent. The energy charge (also called the supply charge) is the per-kWh cost of the electricity you consumed. It is the rate that gets advertised, and the only charge that falls proportionally when you use less. Typical range: 6 to 18 cents per kWh, making up 40 to 70 percent of your total bill. The distribution charge pays for the local wires, poles, transformers, and underground cables that run from the regional grid to your street and into your meter. Your local utility owns this infrastructure and sets this rate through a state-regulated tariff. Typical range: 2 to 5 cents per kWh, plus often a small fixed component. The transmission charge pays for the high-voltage lines that carry electricity from power plants to your local distribution network. Typical range: 0.5 to 2 cents per kWh.
The fixed charges you cannot reduce
The customer charge (also called the service charge or meter charge) is a flat monthly fee for being connected to the grid at all. It covers meter reading, billing administration, and customer service overhead. This charge does not move when your usage moves. Typical range: 5 to 15 dollars per month. If you install solar and cut consumption to near zero, this charge remains. Taxes and riders sit at the bottom of every bill: state and local sales taxes, franchise fees paid to the municipality, and state-mandated program charges (renewable energy funds, low-income assistance programs, efficiency programs). Combined they typically add 1 to 3 cents per kWh on top of everything else.
Residential bill line items (US 2026)
| Line item | Also called | Type | Typical range | Reducible? |
|---|---|---|---|---|
| Energy charge | Supply charge | Per kWh | 6 to 18 c/kWh | Yes. Use less or switch supplier. |
| Distribution charge | Delivery charge | Per kWh + fixed | 2 to 5 c/kWh | No. State-regulated utility monopoly. |
| Transmission charge | Grid charge | Per kWh | 0.5 to 2 c/kWh | No. Regional grid pass-through. |
| Customer charge | Service charge | Fixed monthly | $5 to $15/mo | No. Fixed regardless of usage. |
| Taxes and riders | Surcharges | Per kWh + % | 1 to 3 c/kWh added | No. Legislated. |
Your effective rate vs. your billed rate
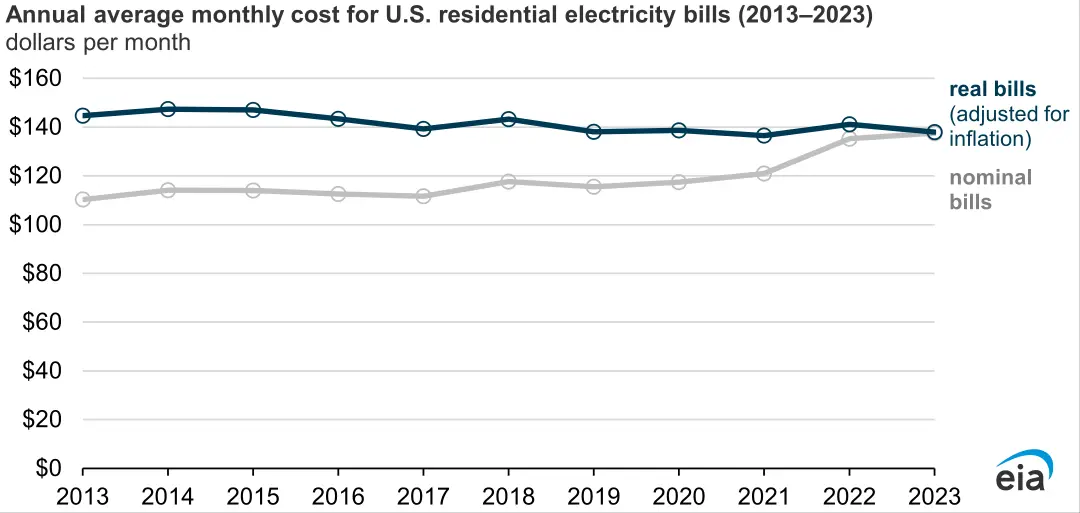
The advertised rate is the energy charge only. Your effective rate is what you pay per kWh once every other charge is included. Divide your total electricity charges by the total kWh shown on your bill. Example: 850 kWh and a total charge of $145 gives an effective rate of 17.1 cents per kWh. If the energy charge listed is 10 cents, the remaining 7.1 cents is distribution, transmission, the customer charge spread across each kWh, and taxes. That markup is normal. The national average effective rate as of mid-2026 is 18.3 cents per kWh (EIA data, up from 17.0 cents in the same months of 2025). The range runs from roughly 10 cents in Louisiana and Idaho to 47 cents in Hawaii.
Average monthly bill and rate by state (EIA 2026)
| State | Avg monthly bill | Rate (c/kWh) | Avg kWh/mo |
|---|---|---|---|
| Hawaii | $243 | 47.2 | 515 |
| Massachusetts | $182 | 30.5 | 596 |
| Maine | $171 | 32.1 | 533 |
| California | $147 | 29.8 | 494 |
| Colorado | $113 | 17.2 | 658 |
| Utah | $101 | 13.3 | 761 |
| Alabama | $187 | 16.3 | 1,145 |
| Florida | $165 | 15.0 | 1,103 |
| Texas | $155 | 15.1 | 1,030 |
| US average | $154 | 18.3 | 843 |
Two bill structures: regulated vs deregulated states
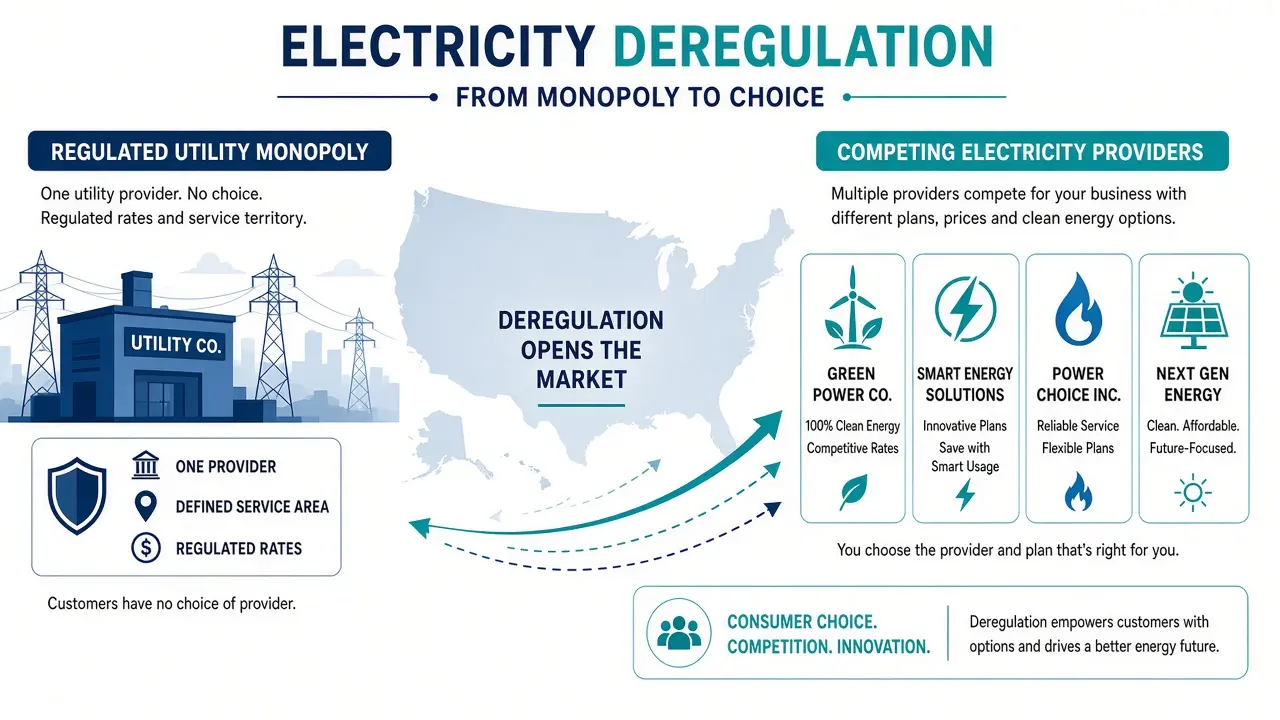
In a regulated state (most of the South, Midwest, and West), one utility company owns the generation, transmission, and local distribution network. It sets one bundled rate approved by your state public utility commission. You cannot shop for a different supplier. Florida Power and Light, Georgia Power, and Pacific Gas and Electric operate this way. In a deregulated state, the local utility still owns the distribution network and your meter, but the energy supply was opened to competition. Retail electricity providers (REPs or ESCOs) buy power on the wholesale market and sell it to you at a margin. If you have never chosen a supplier, you are on the utility default rate. The 13 residential-choice states as of 2026: Texas, Ohio, Pennsylvania, Illinois, New York, New Jersey, Maryland, Massachusetts, Connecticut, Maine, New Hampshire, Rhode Island, and Delaware, plus Washington DC.
In a deregulated state, switching suppliers changes the energy charge only. Distribution, customer charge, and taxes stay identical because those belong to the utility. When a supplier advertises a rate, compare it to the energy charge line on your current bill, not to your total effective rate.
Tiered rates and time-of-use rates
Two rate structures appear on bills beyond the flat per-kWh rate. Tiered rates (also called block rates) charge a lower rate for the first block of kWh each month and a higher rate for usage above a threshold. Pacific Gas and Electric in California uses this structure: the first roughly 300 to 500 kWh fall in Tier 1 and anything above is billed at Tier 2, which is significantly higher. If your bill jumped sharply after a hot August, you may have crossed a tier boundary. Time-of-use (TOU) rates charge different per-kWh prices depending on the time of day. Peak hours (typically 4 pm to 9 pm on weekdays) carry a premium rate; off-peak hours (overnight and weekends) carry a lower rate. TOU plans are common in California, Arizona, and New York. Running your dishwasher, laundry, and electric vehicle charging overnight can reduce a TOU bill by 10 to 25 percent without changing total consumption.
How to investigate a bill spike
If your bill jumped significantly from one month to the next and you did not add an appliance or change your habits, most spikes trace to one of five things. Work through the table below in order.
Bill spike causes and how to check
| Symptom | Most likely cause | How to check |
|---|---|---|
| Bill up 30 to 50% with no new appliances | Estimated read followed by actual read | Look for an E next to kWh on the high bill. Next month corrects it. |
| Bill up in summer or winter only | Heating or cooling load | Compare kWh to the same month last year, not to last month. |
| Bill creeping up 5 to 10% per year | Rate increase | Check utility tariff notices. Most states require 30-day notice. |
| Bill suddenly doubled in a deregulated state | Variable-rate contract rolled to market rate | Check the energy charge line. Call your supplier or switch to default. |
| Constant high bill despite low usage | Faulty appliance or meter error | Pull hourly data from the utility app. Overnight baseline above 0.3 kWh/hr suggests a continuous load. |
You can request a meter accuracy test from your utility at no charge in most states. If the meter is found to be over-registering by more than 2 percent, you are entitled to a billing adjustment for the period of error.